Let's shuffle a deck of cards and deal the first card out. And shuffle again and deal another one. Rinse and repeat 52 times.
Here's what I got using the CoF algo:
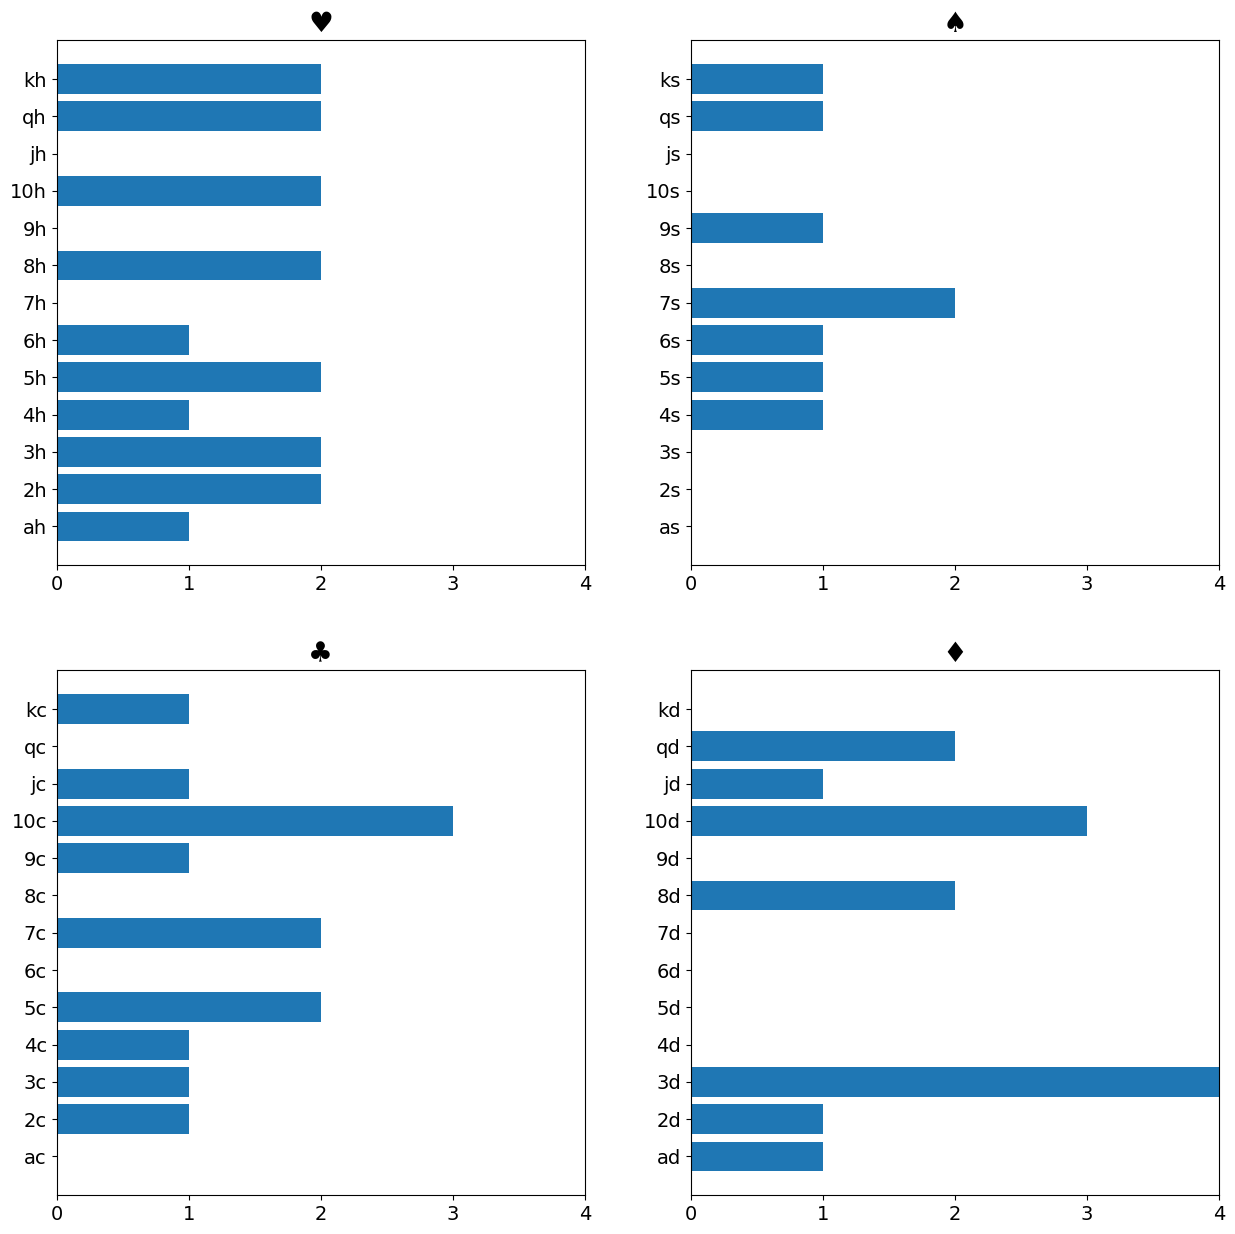
Most of you would agree that this looks random. Even though the distribution is not uniform. Infact, if the distribution was uniform, it would look like something was fishy.
Let's just do it 52 times again and see if there's any pattern
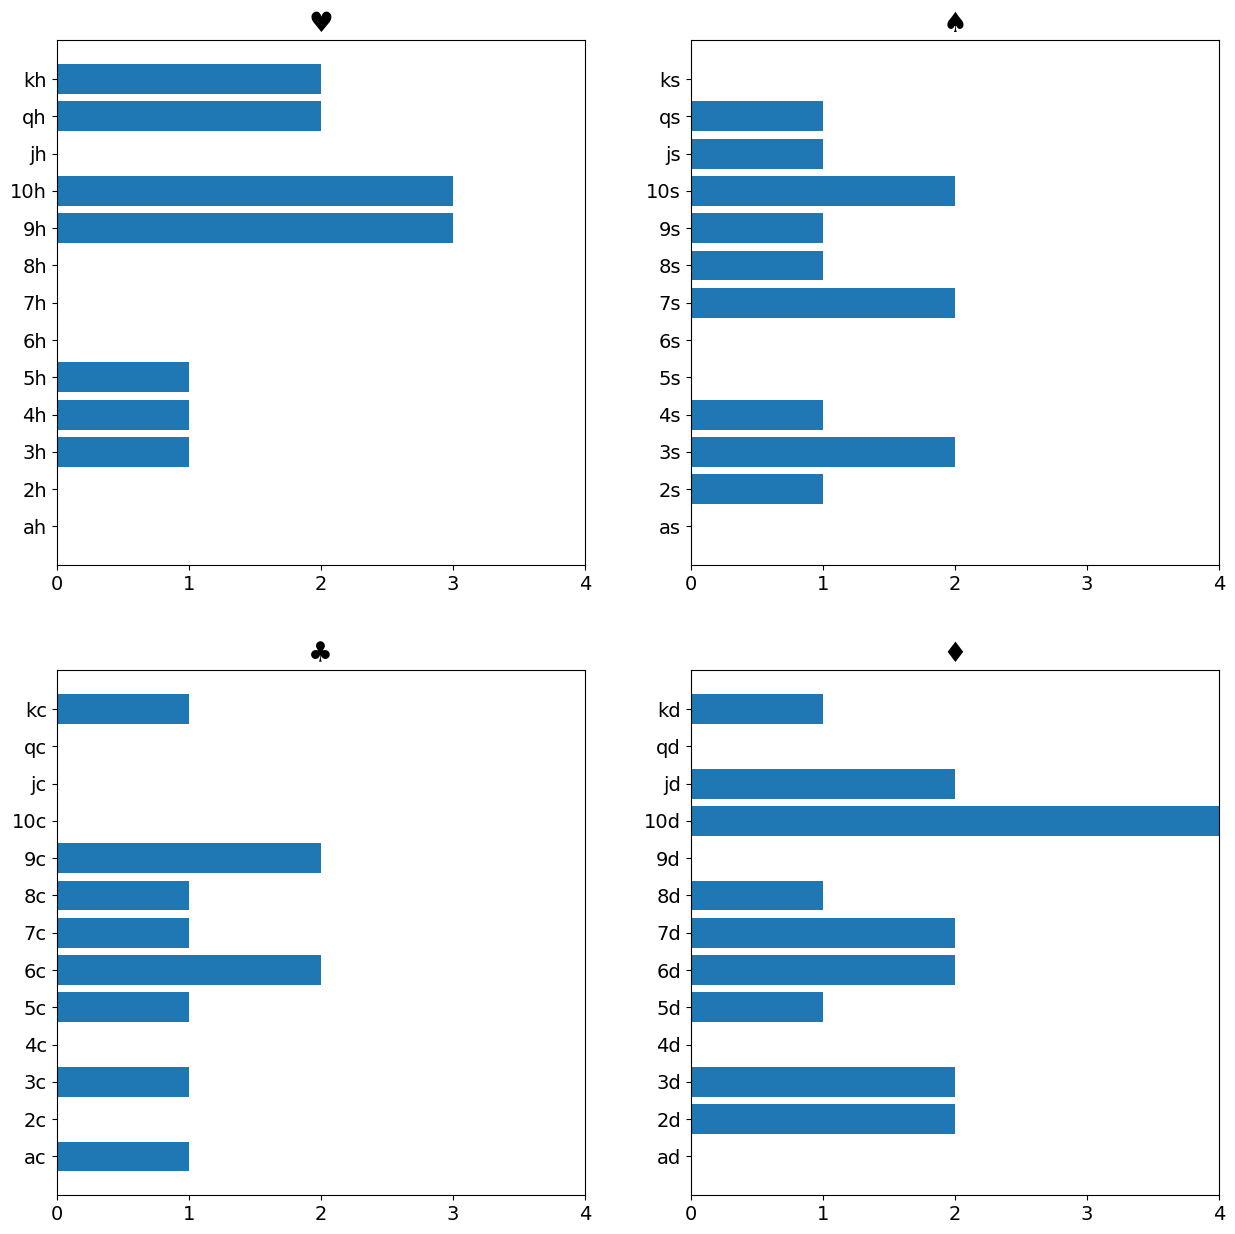
And again...
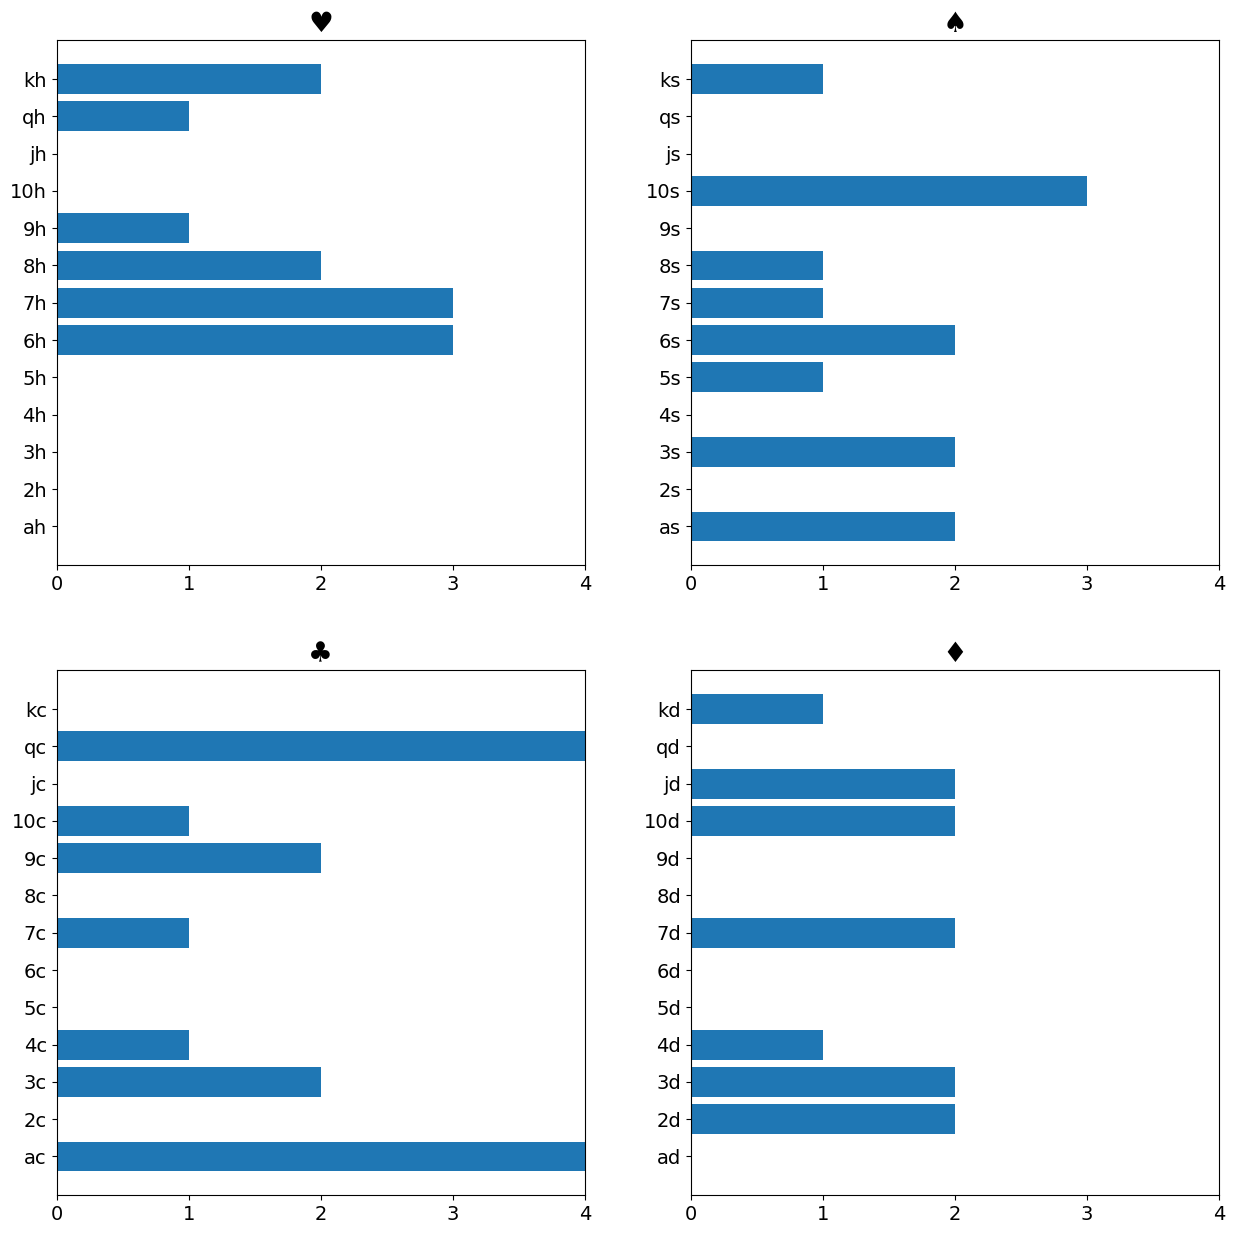
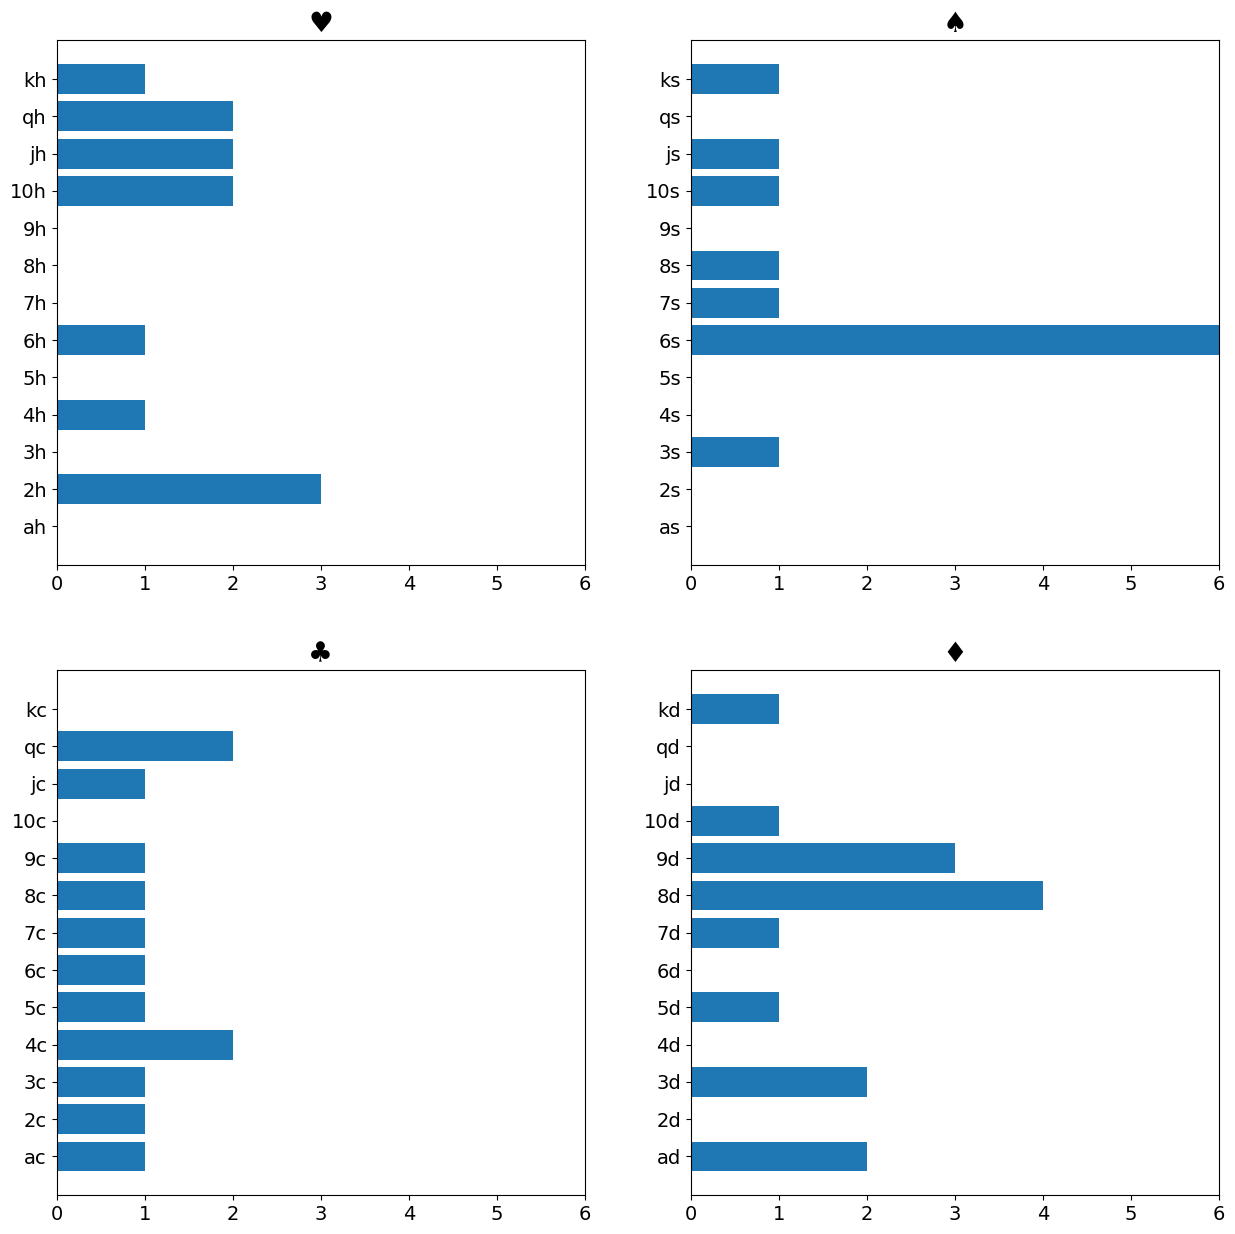
And again...
Let's sum these up to see what happened over these 52 * 4 = 208 deals
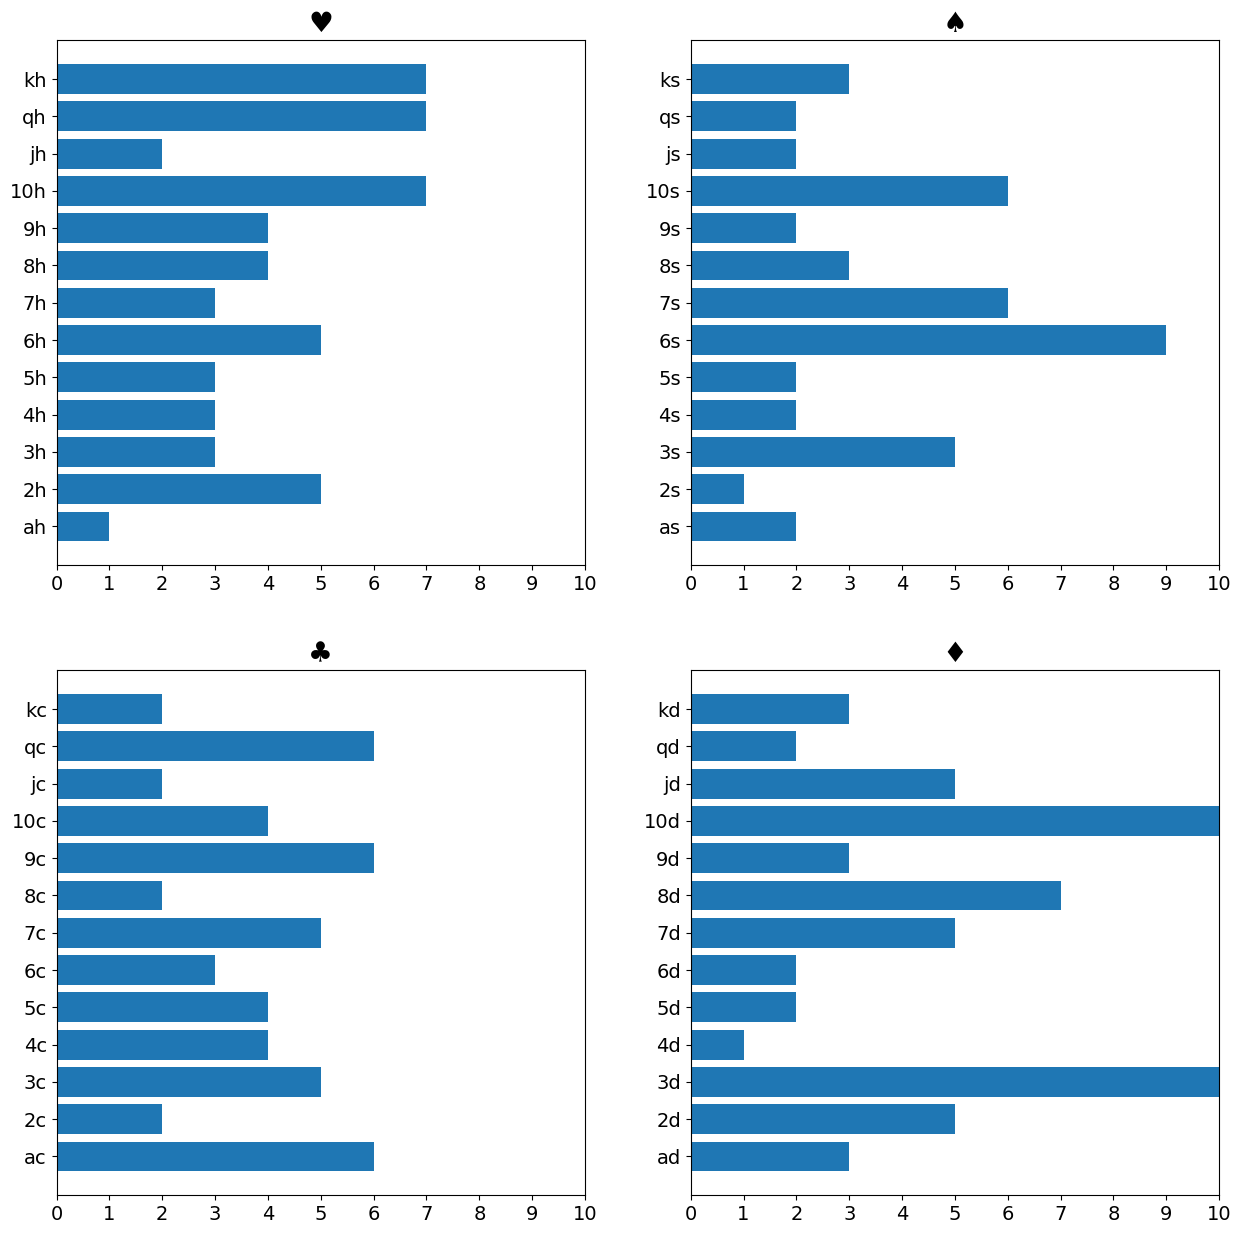
Now we're getting into a zone, where some of you might say that this is not so random. We've dealt a card 208 times, then why is it that 10 of diamonds has appeared 10 times!
Hmmm... well ok, what if we dealt 52 cards * 25 times. Let's see what that looks like
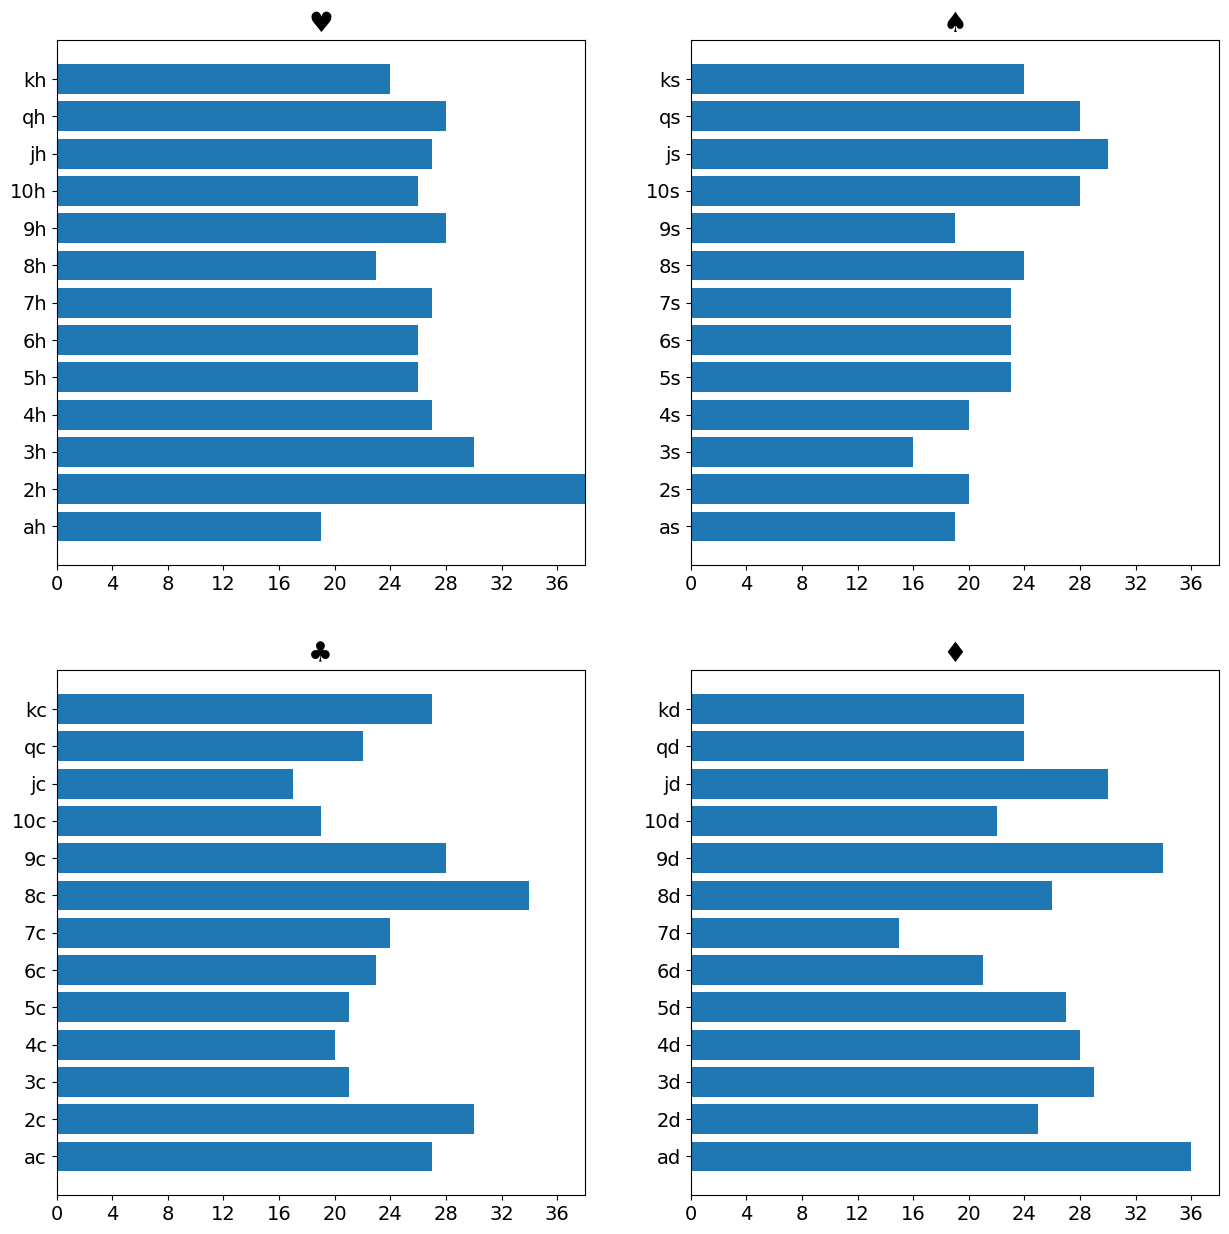
Things start to get more uniform. And just for illustration, let's try 52 x 1000 times, and 52 x 10,000 times
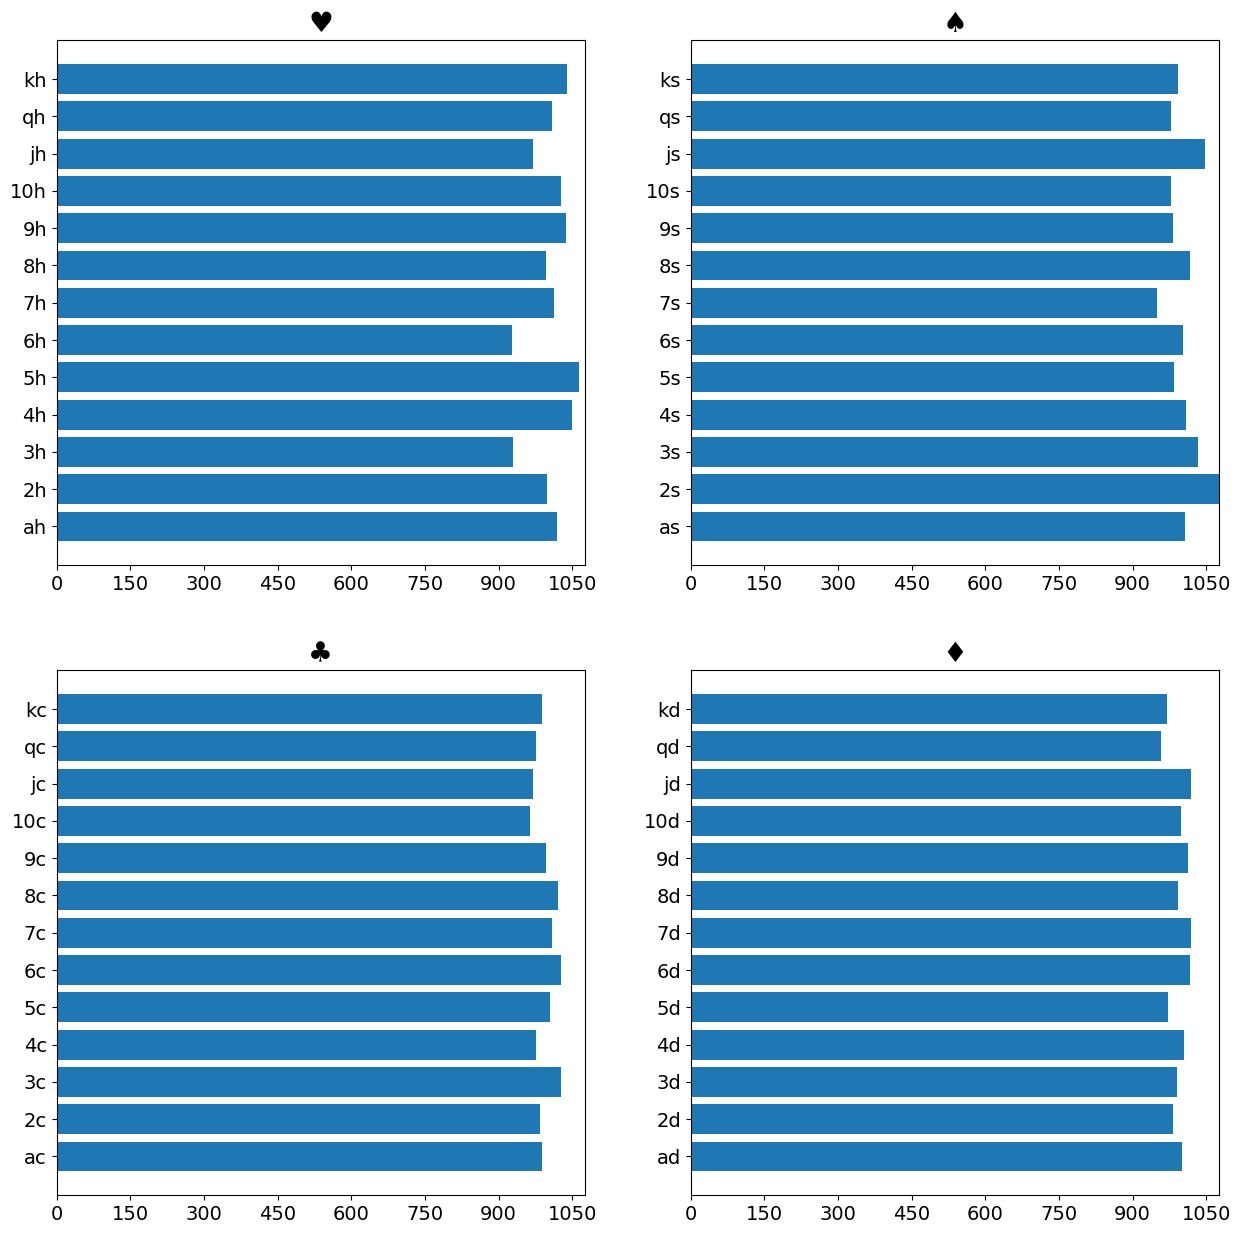
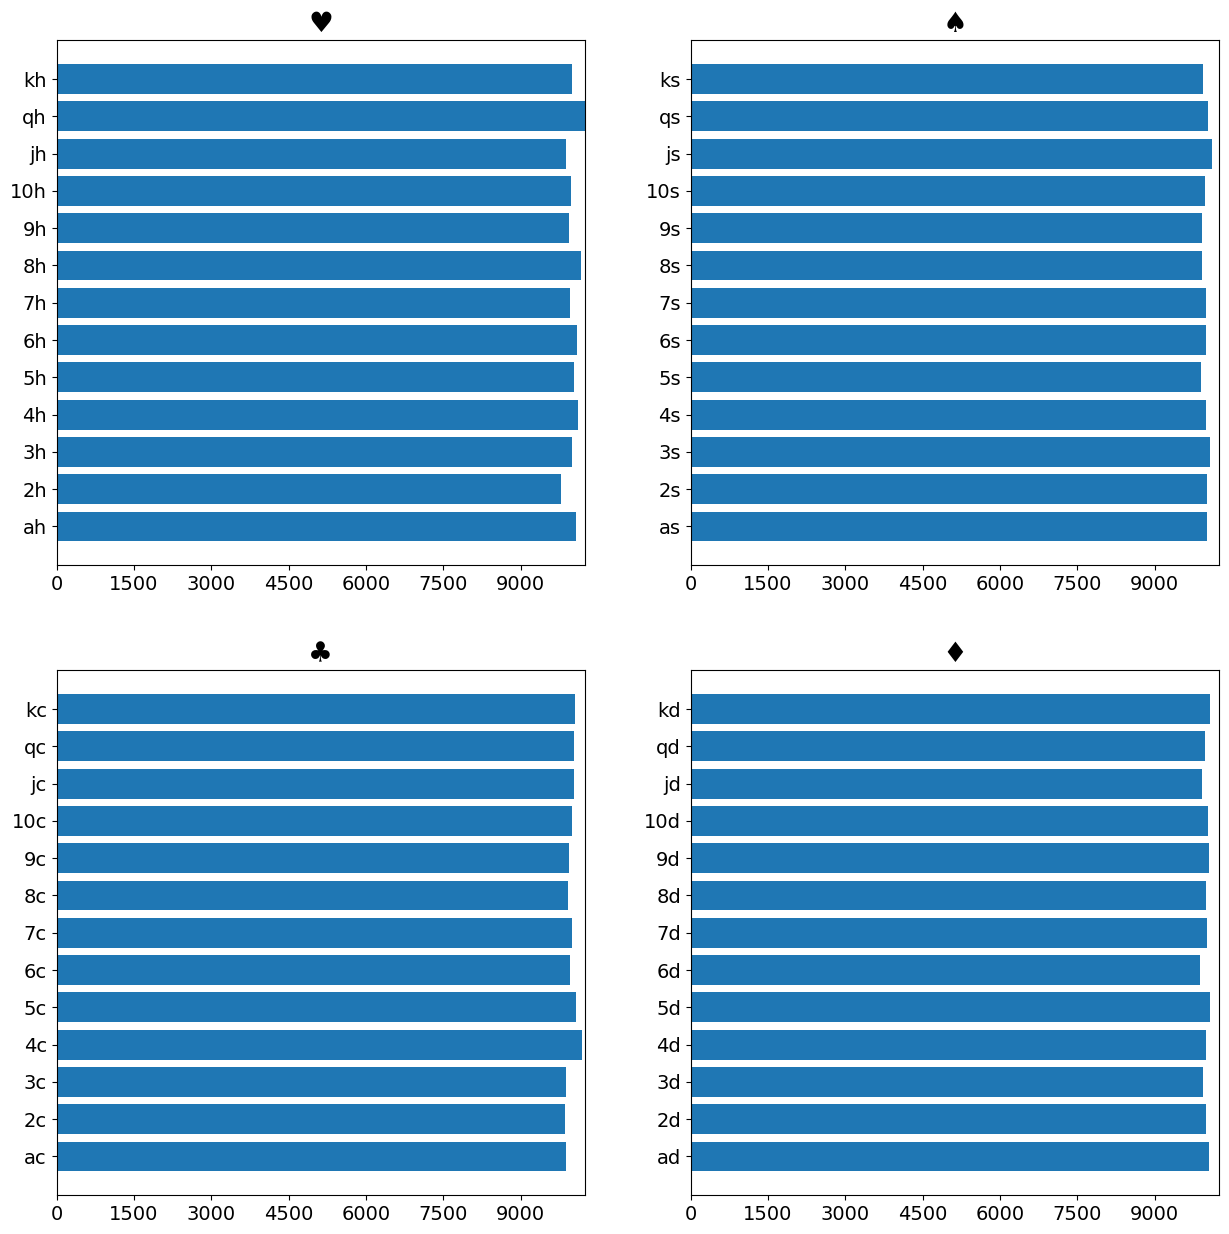
And things start to get more uniform.
The cynical might think, that there may be a hidden pattern that cannot be observed from just the distribution counts.
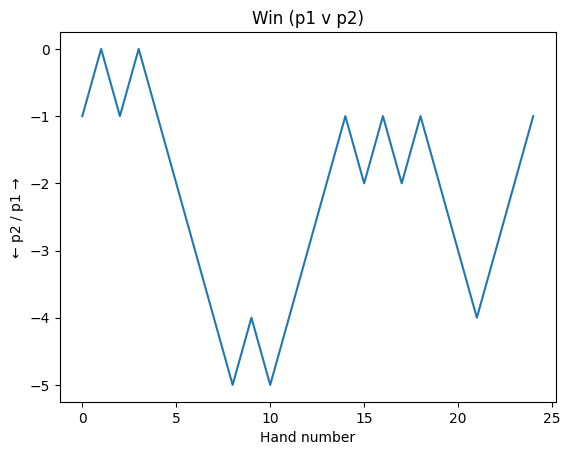
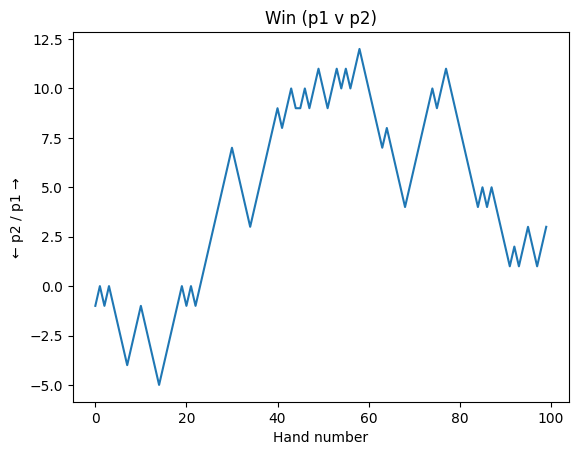
So let's try another analysis. Let's assume a heads up poker game, and deal the flop, and then let's compare if any particular player is getting the advantage of a better hand. Here's how we'll visualize this, if player 1 wins we will give +1, and if player 2 wins we will give -1 as the score. Ties will be 0.
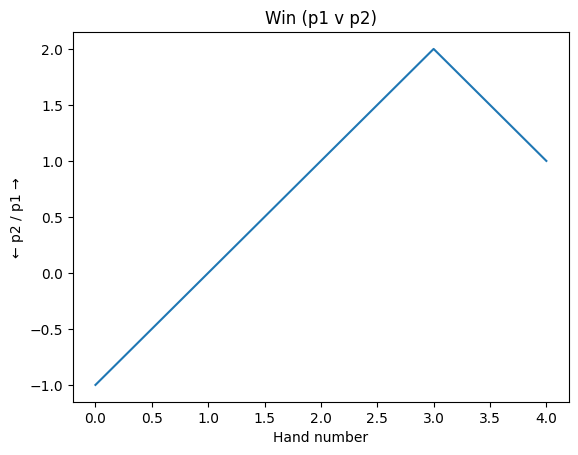
So for 5 heads up flop deals, here's what we get:
[-1, 1, 1, 1, -1]
Plotting this makes it easier to visualize
Let's do 25 hands this time:
A 100 hands:
500 hands:
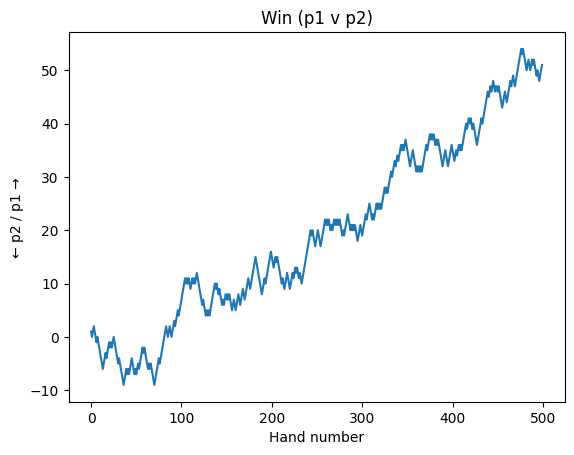
Whoa Whoa! What happened here. This looks a little weird right? Or is it??
Clearly P1 seems to be on a run here with some good luck. I mean it could happen, over 500 hands, p1 has one 50 more hands than P2. Just to see what another 500 looks like, I ran this one again...
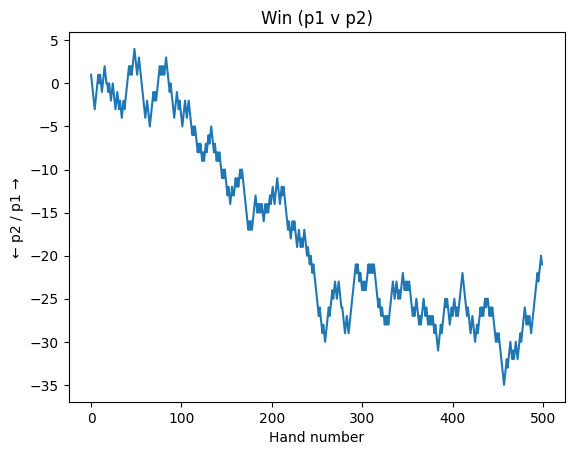
Two more times for good measure...
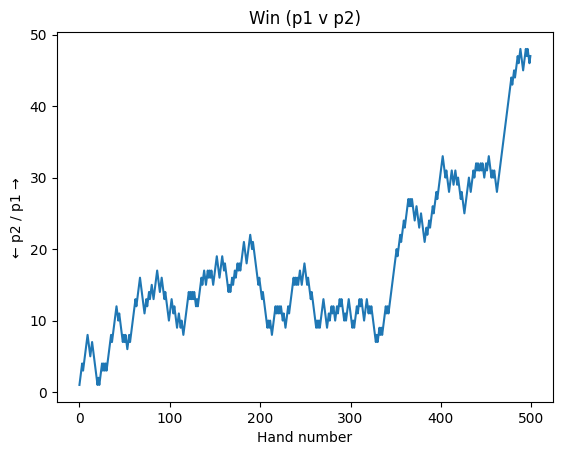
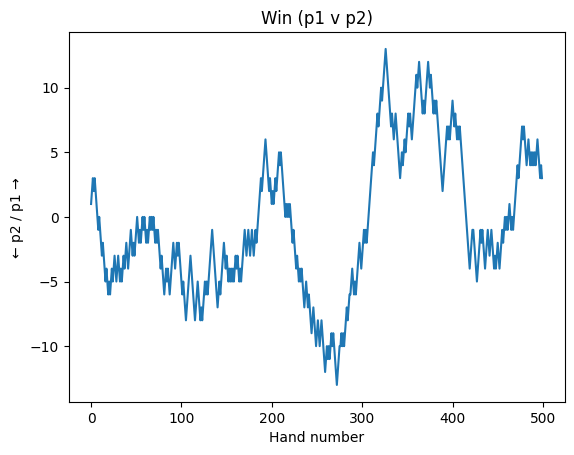
So clearly there are these "win streaks". Are those programmed to be like that. Hell no! A couple of points here though :
- I haven't gone into the type of hands here. Even though a certain player is getting a better hand, many times in the flow of the game, it would be really hard to capitalize on that with imperfect information.
- There will be many instances in a streak where the hands might have been really close, and the loser will get a bad beat. This would give them an exaggerated sense of something being "fishy".
Let's see what the variance looks like over 10,000 hands:
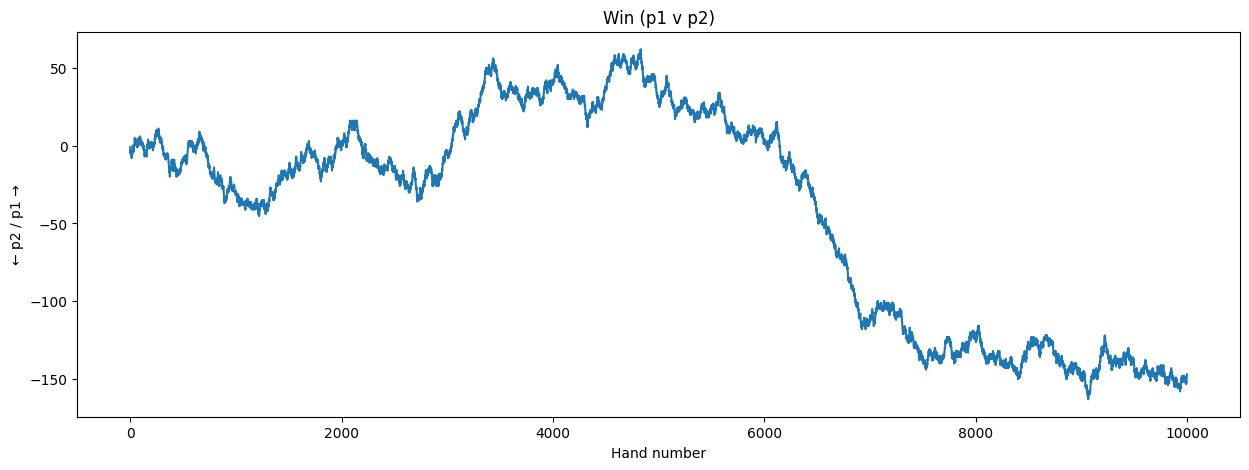
In this run, P2 won about 150 more hands than P1... over 10K hands. So that seems pretty OK to me. Very interesting to see those streaks though. This is all being done using a simple random number generator. But if P1 were to be running into the bad luck from around hand 5000 to 7000, they would NOT think so. And no matter what I do, I can't convince them otherwise. So it'll be a bad review on the app stores, and the group will probably not use this app again.
In a funny way, I appreciate this churn. I am the little guy, waiting to win users from other apps! 😂
But for a good player, it would not matter over this many hands. They'll have their way regardless.
I can open up the code notebook for you to try all this out if you don't believe me. Just let me know. I didn't do that right away as my code is in Dart. To keep things honest I was doing the data generation using the exact same algorithm that is used in the game. And then I was using a Python notebook to just copy-paste that data and plot it.
I am pretty sure that we'll get similar results in pure Python as well.
PS. Ran the 10k hands simulation 4 more times. Here are the results:
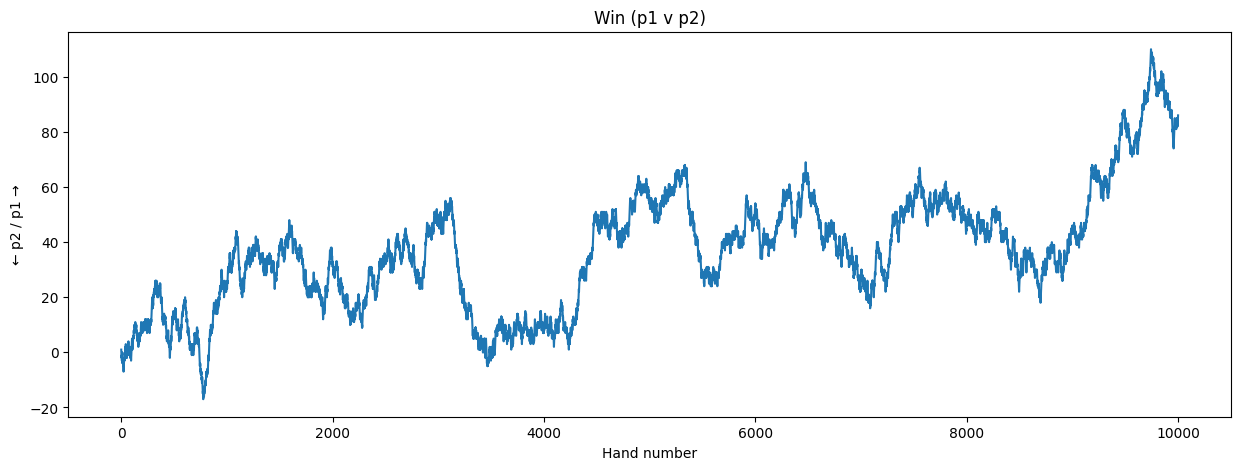
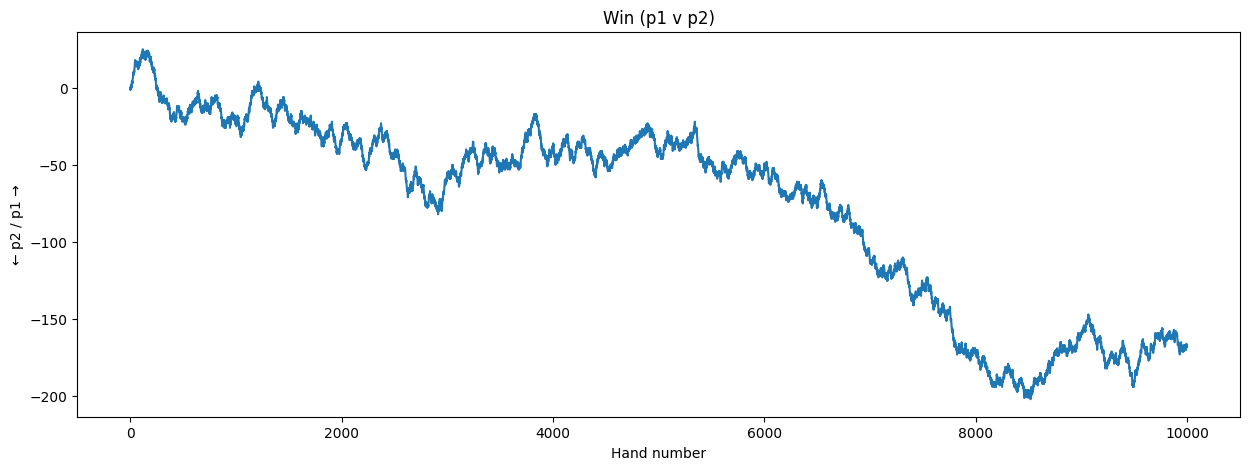
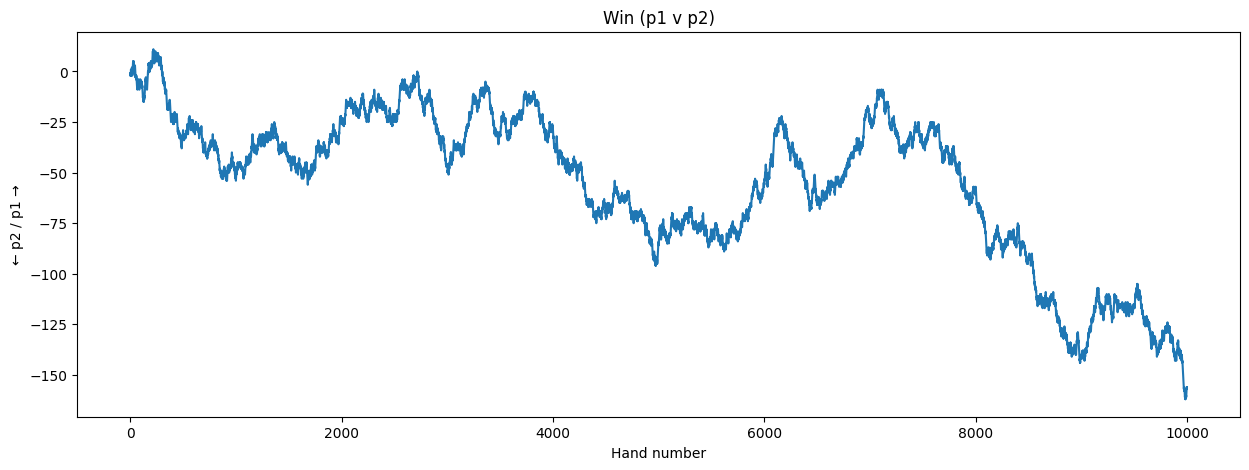
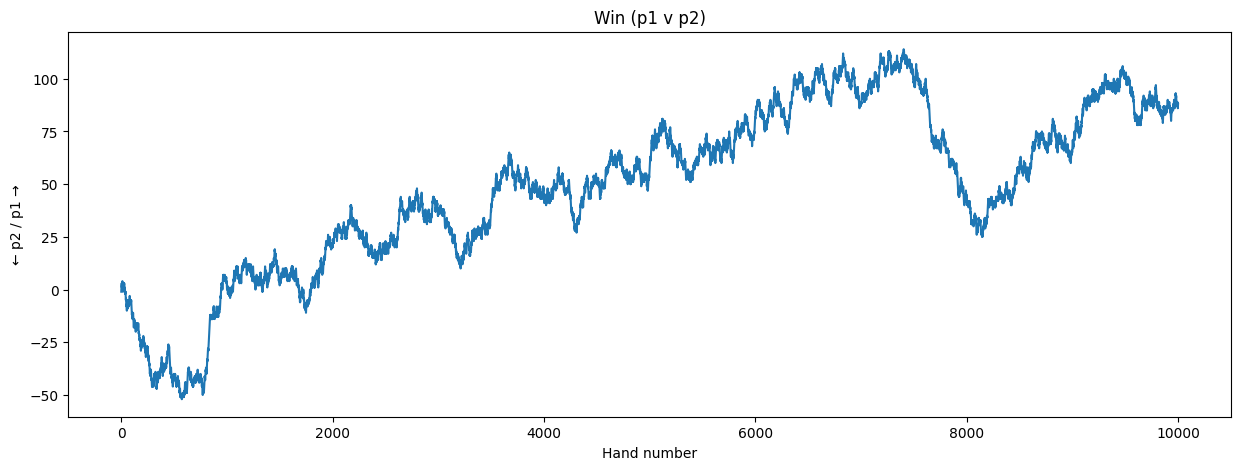
Streaks all around! 🤷